The Fraser Valley Real Estate Board reports that the local market returned to more normalized volume in February
[alert type=”info” dismiss=”true”]This article is optimized for Accelerated Mobile Pages (AMP)[/alert]
FEBRUARY 2017 STATISTICS REPORT
The Fraser Valley Real Estate Board reports that the local market returned to more normalized volume in February. While this is the case, we still see prices heavily influenced by low inventory and the feeding frenzy of last year. The Condo and Townhome markets in Langley and Cloverdale are especially hot; we are again seeing multiple offers and prices over asking.
If you are considering selling or just have questions about the market, please give us a call today and let’s chat.
[bctt tweet=”Condo & Townhome Market In Langley Very Hot In February – #LangleyBC” username=”jwsrealestate”]
Click These Buttons To Jump To That Areas Summary
. – – – – – – – –
.

All Fraser Valley Areas Combined
Abbotsford – Mission – White Rock – Langley – Delta/North – Surrey Central – Cloverdale – Surrey/North
Detached
|
|
Feb-17 |
Feb-16 |
% change |
Jan-17 |
% change |
| Sales |
489 |
1,243 |
-60.7% |
360 |
35.8% |
| New Listings |
858 |
1,648 |
-47.9% |
871 |
-1.5% |
| Active Listings |
1,881 |
1,582 |
18.9% |
1,787 |
5.3% |
| Benchmark Price |
$ 859,300 |
$ 714,000 |
20.4% |
$ 856,300 |
0.4% |
| Median Price |
$ 825,000 |
$ 775,000 |
6.5% |
$ 790,000 |
4.4% |
| Average Price |
$ 912,378 |
$ 896,955 |
1.7% |
$ 890,117 |
2.5% |
Townhouse
|
|
Feb-17 |
Feb-16 |
% change |
Jan-17 |
% change |
| Sales |
369 |
526 |
-29.8% |
212 |
74.1% |
| New Listings |
427 |
551 |
-22.5% |
401 |
6.5% |
| Active Listings |
506 |
621 |
-18.5% |
524 |
-3.4% |
| Benchmark Price |
$ 422,400 |
$ 337,300 |
25.2% |
$ 420,400 |
0.5% |
| Median Price |
$ 489,000 |
$ 370,850 |
31.9% |
$ 461,150 |
6.0% |
| Average Price |
$ 484,196 |
$ 396,721 |
22.0% |
$ 477,964 |
1.3% |
Apartment – Condo
|
|
Feb-17 |
Feb-16 |
% change |
Jan-17 |
% change |
| Sales |
391 |
388 |
0.8% |
276 |
41.7% |
| New Listings |
474 |
583 |
-18.7% |
518 |
-8.5% |
| Active Listings |
608 |
1,170 |
-48.0% |
594 |
2.4% |
| Benchmark Price |
$ 267,000 |
$ 211,000 |
26.5% |
$ 262,300 |
1.8% |
| Median Price |
$ 275,000 |
$ 232,000 |
18.5% |
$ 255,950 |
7.4% |
| Average Price |
$ 286,001 |
$ 252,208 |
13.4% |
$ 295,865 |
-3.3% |
. – – – – – – – –
Abbotsford
Detached
|
|
Feb-17 |
Feb-16 |
% change |
Jan-17 |
% change |
| Sales |
70 |
210 |
-66.7% |
70 |
0.0% |
| New Listings |
98 |
245 |
-60.0% |
109 |
-10.1% |
| Active Listings |
227 |
220 |
3.2% |
217 |
4.6% |
| Benchmark Price |
$ 673,600 |
$ 531,400 |
26.8% |
$ 670,700 |
0.4% |
| Median Price |
$ 648,000 |
$ 547,350 |
18.4% |
$ 619,250 |
4.6% |
| Average Price |
$ 684,928 |
$ 569,540 |
20.3% |
$ 644,067 |
6.3% |
Townhouse
|
|
Feb-17 |
Feb-16 |
% change |
Jan-17 |
% change |
| Sales |
40 |
91 |
-56.0% |
24 |
66.7% |
| New Listings |
42 |
80 |
-47.5% |
28 |
50.0% |
| Active Listings |
51 |
117 |
-56.4% |
53 |
-3.8% |
| Benchmark Price |
$ 294,500 |
$ 236,600 |
24.5% |
$ 298,200 |
-1.2% |
| Median Price |
$ 351,073 |
$ 314,900 |
11.5% |
$ 320,000 |
9.7% |
| Average Price |
$ 356,617 |
$ 313,702 |
13.7% |
$ 340,710 |
4.7% |
Apartment – Condo
|
|
Feb-17 |
Feb-16 |
% change |
Jan-17 |
% change |
| Sales |
86 |
58 |
48.3% |
42 |
104.8% |
| New Listings |
92 |
85 |
8.2% |
74 |
24.3% |
| Active Listings |
108 |
172 |
-37.2% |
110 |
-1.8% |
| Benchmark Price |
$ 222,600 |
$ 157,300 |
41.5% |
$ 218,100 |
2.1% |
| Median Price |
$ 209,750 |
$ 151,500 |
38.4% |
$ 191,000 |
9.8% |
| Average Price |
$ 222,852 |
$ 159,459 |
39.8% |
$ 197,144 |
13.0% |
. – – – – – – – –
Mission
Detached
|
|
Feb-17 |
Feb-16 |
% change |
Jan-17 |
% change |
| Sales |
37 |
83 |
-55.4% |
19 |
94.7% |
| New Listings |
58 |
87 |
-33.3% |
38 |
52.6% |
| Active Listings |
115 |
115 |
0.0% |
113 |
1.8% |
| Benchmark Price |
$ 545,400 |
$ 440,000 |
24.0% |
$ 546,200 |
-0.1% |
| Median Price |
$ 529,400 |
$ 460,000 |
15.1% |
$ 625,000 |
-15.3% |
| Average Price |
$ 573,498 |
$ 474,507 |
20.9% |
$ 619,669 |
-7.5% |
Townhouse
|
|
Feb-17 |
Feb-16 |
% change |
Jan-17 |
% change |
| Sales |
6 |
5 |
20.0% |
3 |
100.0% |
| New Listings |
6 |
6 |
0.0% |
6 |
0.0% |
| Active Listings |
15 |
28 |
-46.4% |
16 |
-6.3% |
| Benchmark Price |
$ 341,700 |
$ 255,300 |
33.8% |
$ 342,800 |
-0.3% |
| Median Price |
$ 387,047 |
$ 249,000 |
55.4% |
$ 200,000 |
93.5% |
| Average Price |
$ 391,324 |
$ 255,548 |
53.1% |
$ 246,796 |
58.6% |
Apartment – Condo
|
|
Feb-17 |
Feb-16 |
% change |
Jan-17 |
% change |
| Sales |
5 |
9 |
-44.4% |
5 |
0.0% |
| New Listings |
4 |
7 |
-42.9% |
13 |
-69.2% |
| Active Listings |
12 |
18 |
-33.3% |
13 |
-7.7% |
| Benchmark Price |
$ 227,800 |
$ 182,000 |
25.2% |
$ 224,000 |
1.7% |
| Median Price |
$ 163,250 |
$ 205,000 |
-20.4% |
$ 215,000 |
-24.1% |
| Average Price |
$ 170,830 |
$ 177,222 |
-3.6% |
$ 198,580 |
-14.0% |
. – – – – – – – –
White Rock
Detached
|
|
Feb-17 |
Feb-16 |
% change |
Jan-17 |
% change |
| Sales |
73 |
223 |
-67.3% |
44 |
65.9% |
| New Listings |
178 |
298 |
-40.3% |
240 |
-25.8% |
| Active Listings |
476 |
346 |
37.6% |
429 |
11.0% |
| Benchmark Price |
$1,441,200 |
$ 1,163,900 |
23.8% |
$ 1,422,700 |
1.3% |
| Median Price |
$1,306,000 |
$ 1,340,000 |
-2.5% |
$ 1,409,500 |
-7.3% |
| Average Price |
$1,490,496 |
$ 1,541,529 |
-3.3% |
$ 1,490,197 |
0.0% |
Townhouse
|
|
Feb-17 |
Feb-16 |
% change |
Jan-17 |
% change |
| Sales |
45 |
106 |
-57.5% |
36 |
25.0% |
| New Listings |
73 |
85 |
-14.1% |
79 |
-7.6% |
| Active Listings |
106 |
91 |
16.5% |
97 |
9.3% |
| Benchmark Price |
$ 570,600 |
$ 471,700 |
21.0% |
$ 572,200 |
-0.3% |
| Median Price |
$ 555,000 |
$ 505,000 |
9.9% |
$ 615,100 |
-9.8% |
| Average Price |
$ 611,929 |
$ 537,271 |
13.9% |
$ 657,808 |
-7.0% |
Apartment – Condo
|
|
Feb-17 |
Feb-16 |
% change |
Jan-17 |
% change |
| Sales |
73 |
112 |
-34.8% |
56 |
30.4% |
| New Listings |
74 |
127 |
-41.7% |
104 |
-28.8% |
| Active Listings |
109 |
237 |
-54.0% |
130 |
-16.2% |
| Benchmark Price |
$ 349,800 |
$ 283,100 |
23.6% |
$ 345,800 |
1.2% |
| Median Price |
$ 359,900 |
$ 317,000 |
13.5% |
$ 377,888 |
-4.8% |
| Average Price |
$ 370,090 |
$ 334,502 |
10.6% |
$ 423,149 |
-12.5% |
. – – – – – – – –
Langley
Detached
|
|
Feb-17 |
Feb-16 |
% change |
Jan-17 |
% change |
| Sales |
84 |
204 |
-58.8% |
63 |
33.3% |
| New Listings |
130 |
279 |
-53.4% |
115 |
13.0% |
| Active Listings |
210 |
198 |
6.1% |
189 |
11.1% |
| Benchmark Price |
$ 866,900 |
$ 722,800 |
19.9% |
$ 866,500 |
0.0% |
| Median Price |
$ 850,000 |
$ 865,250 |
-1.8% |
$ 799,000 |
6.4% |
| Average Price |
$ 864,712 |
$ 913,821 |
-5.4% |
$ 848,110 |
2.0% |
Townhouse
|
|
Feb-17 |
Feb-16 |
% change |
Jan-17 |
% change |
| Sales |
87 |
84 |
3.6% |
56 |
55.4% |
| New Listings |
91 |
95 |
-4.2% |
102 |
-10.8% |
| Active Listings |
88 |
75 |
17.3% |
101 |
-12.9% |
| Benchmark Price |
$ 430,500 |
$ 348,600 |
23.5% |
$ 429,900 |
0.1% |
| Median Price |
$ 505,900 |
$ 358,450 |
41.1% |
$ 477,250 |
6.0% |
| Average Price |
$ 494,776 |
$ 383,758 |
28.9% |
$ 480,178 |
3.0% |
Apartment – Condo
|
|
Feb-17 |
Feb-16 |
% change |
Jan-17 |
% change |
| Sales |
71 |
61 |
16.4% |
56 |
26.8% |
| New Listings |
90 |
110 |
-18.2% |
100 |
-10.0% |
| Active Listings |
84 |
157 |
-46.5% |
79 |
6.3% |
| Benchmark Price |
$ 283,100 |
$ 219,600 |
28.9% |
$ 279,300 |
1.4% |
| Median Price |
$ 291,000 |
$ 226,000 |
28.8% |
$ 251,950 |
15.5% |
| Average Price |
$ 298,178 |
$ 244,855 |
21.8% |
$ 281,437 |
5.9% |
. – – – – – – – –
Delta – North
Detached
|
|
Feb-17 |
Feb-16 |
% change |
Jan-17 |
% change |
| Sales |
37 |
74 |
-50.0% |
23 |
60.9% |
| New Listings |
58 |
111 |
-47.7% |
43 |
34.9% |
| Active Listings |
118 |
83 |
42.2% |
120 |
-1.7% |
| Benchmark Price |
$ 819,600 |
$ 746,600 |
9.8% |
$ 828,200 |
-1.0% |
| Median Price |
$ 820,000 |
$ 808,250 |
1.5% |
$ 941,000 |
-12.9% |
| Average Price |
$ 859,905 |
$ 876,450 |
-1.9% |
$ 1,006,971 |
-14.6% |
Townhouse
|
|
Feb-17 |
Feb-16 |
% change |
Jan-17 |
% change |
| Sales |
7 |
7 |
0.0% |
2 |
250.0% |
| New Listings |
7 |
11 |
-36.4% |
10 |
-30% |
| Active Listings |
15 |
11 |
36.4% |
19 |
-21.1% |
| Benchmark Price |
$ 482,900 |
$ 377,200 |
28.0% |
$ 474,500 |
1.8% |
| Median Price |
$ 558,000 |
$ 604,761 |
-7.7% |
$ 655,500 |
-14.9% |
| Average Price |
$ 577,228 |
$ 457,472 |
26.2% |
$ 655,500 |
-11.9% |
Apartment – Condo
|
|
Feb-17 |
Feb-16 |
% change |
Jan-17 |
% change |
| Sales |
4 |
6 |
33.3% |
4 |
0.0% |
| New Listings |
9 |
8 |
12.5% |
9 |
0.0% |
| Active Listings |
13 |
24 |
-45.8% |
10 |
30.0% |
| Benchmark Price |
$ 202,800 |
$ 164,600 |
23.2% |
$ 198,000 |
2.4% |
| Median Price |
$ 349,950 |
$ 181,250 |
93.1% |
$ 324,900 |
7.7% |
| Average Price |
$ 352,450 |
$ 167,833 |
110.0% |
$ 377,150 |
-6.5% |
. – – – – – – – –
Surrey – Central
Detached
|
|
Feb-17 |
Feb-16 |
% change |
Jan-17 |
% change |
| Sales |
95 |
253 |
-62.5% |
72 |
31.9% |
| New Listings |
165 |
306 |
-46.1% |
156 |
5.8% |
| Active Listings |
357 |
319 |
11.9% |
360 |
-0.8% |
| Benchmark Price |
$ 866,900 |
$ 712,300 |
21.7% |
$ 862,000 |
0.6% |
| Median Price |
$ 842,500 |
$ 764,900 |
10.1% |
$ 825,000 |
2.1% |
| Average Price |
$ 874,848 |
$ 800,566 |
9.3% |
$ 894,463 |
-2.2% |
Townhouse
|
|
Feb-17 |
Feb-16 |
% change |
Jan-17 |
% change |
| Sales |
112 |
131 |
-14.5% |
61 |
83.6% |
| New Listings |
136 |
147 |
-7.5% |
113 |
20.4% |
| Active Listings |
158 |
177 |
-10.7% |
151 |
4.6% |
| Benchmark Price |
$ 443,500 |
$ 343,100 |
29.3% |
$ 436,900 |
1.5% |
| Median Price |
$ 483,250 |
$ 360,000 |
34.2% |
$ 451,000 |
7.2% |
| Average Price |
$ 474,410 |
$ 377,375 |
25.7% |
$ 464,041 |
2.2% |
Apartment – Condo
|
|
Feb-17 |
Feb-16 |
% change |
Jan-17 |
% change |
| Sales |
26 |
38 |
-31.6% |
20 |
30.0% |
| New Listings |
39 |
57 |
-31.6% |
39 |
0.0% |
| Active Listings |
54 |
161 |
-66.5% |
43 |
25.6% |
| Benchmark Price |
$ 242,300 |
$ 206,700 |
17.2% |
$ 238,100 |
1.8% |
| Median Price |
$ 251,750 |
$ 222,400 |
13.2% |
$ 242,500 |
3.8% |
| Average Price |
$ 255,004 |
$ 225,403 |
13.1% |
$ 253,830 |
0.5% |
. – – – – – – – –
Surrey – Cloverdale
Detached
|
|
Feb-17 |
Feb-16 |
% change |
Jan-17 |
% change |
| Sales |
44 |
88 |
-50.0% |
23 |
91.3% |
| New Listings |
63 |
159 |
-60.4% |
53 |
18.9% |
| Active Listings |
96 |
128 |
-25.0% |
87 |
10.3% |
| Benchmark Price |
$ 865,100 |
$ 733,600 |
17.9% |
$ 863,200 |
0.2% |
| Median Price |
$ 827,450 |
$ 770,000 |
7.5% |
$ 830,000 |
-0.3% |
| Average Price |
$ 863,332 |
$ 810,599 |
6.5% |
$ 849,099 |
1.7% |
Townhouse
|
|
Feb-17 |
Feb-16 |
% change |
Jan-17 |
% change |
| Sales |
46 |
66 |
-30.3% |
18 |
155.6% |
| New Listings |
47 |
87 |
-46.0% |
44 |
6.8% |
| Active Listings |
40 |
60 |
-33.3% |
50 |
-20.0% |
| Benchmark Price |
$ 457,100 |
$ 380,000 |
20.3% |
$ 456,400 |
0.2% |
| Median Price |
$ 499,400 |
$ 386,300 |
29.3% |
$ 435,000 |
14.8% |
| Average Price |
$ 489,336 |
$ 382,504 |
27.9% |
$ 438,538 |
11.6% |
Apartment – Condo
|
|
Feb-17 |
Feb-16 |
% change |
Jan-17 |
% change |
| Sales |
29 |
30 |
-3.3% |
21 |
38.1% |
| New Listings |
32 |
35 |
-8.6% |
33 |
-3.0% |
| Active Listings |
32 |
52 |
-38.5% |
35 |
-8.6% |
| Benchmark Price |
$ 318,200 |
$ 250,300 |
27.1% |
$ 311,500 |
2.2% |
| Median Price |
$ 280,000 |
$ 240,500 |
16.4% |
$ 267,000 |
4.9% |
| Average Price |
$ 279,120 |
$ 265,218 |
5.2% |
$ 312,431 |
-10.7% |
. – – – – – – – –
Surrey – North
Detached
|
|
Feb-17 |
Feb-16 |
% change |
Jan-17 |
% change |
| Sales |
49 |
107 |
-54.2% |
45 |
8.9% |
| New Listings |
107 |
163 |
-34.4% |
116 |
-7.8% |
| Active Listings |
277 |
168 |
64.9% |
257 |
7.8% |
| Benchmark Price |
$ 821,600 |
$ 711,400 |
15.5% |
$ 821,900 |
0.0% |
| Median Price |
$ 820,000 |
$ 730,000 |
12.3% |
$ 725,000 |
13.1% |
| Average Price |
$ 870,057 |
$ 808,868 |
7.6% |
$ 825,293 |
5.4% |
Townhouse
|
|
Feb-17 |
Feb-16 |
% change |
Jan-17 |
% change |
| Sales |
26 |
36 |
-27.8% |
12 |
116.7% |
| New Listings |
25 |
40 |
-37.5% |
19 |
31.6% |
| Active Listings |
33 |
62 |
-46.8% |
37 |
-10.8% |
| Benchmark Price |
$ 355,500 |
$ 267,400 |
32.9% |
$ 348,300 |
2.1% |
| Median Price |
$ 478,400 |
$ 297,000 |
61.1% |
$ 357,000 |
34.0% |
| Average Price |
$ 453,442 |
$ 327,244 |
38.6% |
$ 360,729 |
25.7% |
Apartment – Condo
|
|
Feb-17 |
Feb-16 |
% change |
Jan-17 |
% change |
| Sales |
97 |
73 |
32.9% |
72 |
34.7% |
| New Listings |
134 |
154 |
-13.0% |
146 |
-8.2% |
| Active Listings |
196 |
349 |
-43.8% |
174 |
12.6% |
| Benchmark Price |
$ 244,800 |
$ 204,700 |
19.6% |
$ 239,900 |
2.0% |
| Median Price |
$ 280,000 |
$ 231,000 |
21.2% |
$ 269,950 |
3.7% |
| Average Price |
$ 283,354 |
$ 232,372 |
21.9% |
$ 274,760 |
3.1% |
.
[bctt tweet=”1,396 sales of all property types | Fraser Valley – February 2017 – #LangleyBC” username=”jwsrealestate”]
.
CLICK ON THE IMAGE TO VIEW CHART
–
|
What Does FVREB Have To Say?
Fraser Valley Enjoys Healthy Market In February
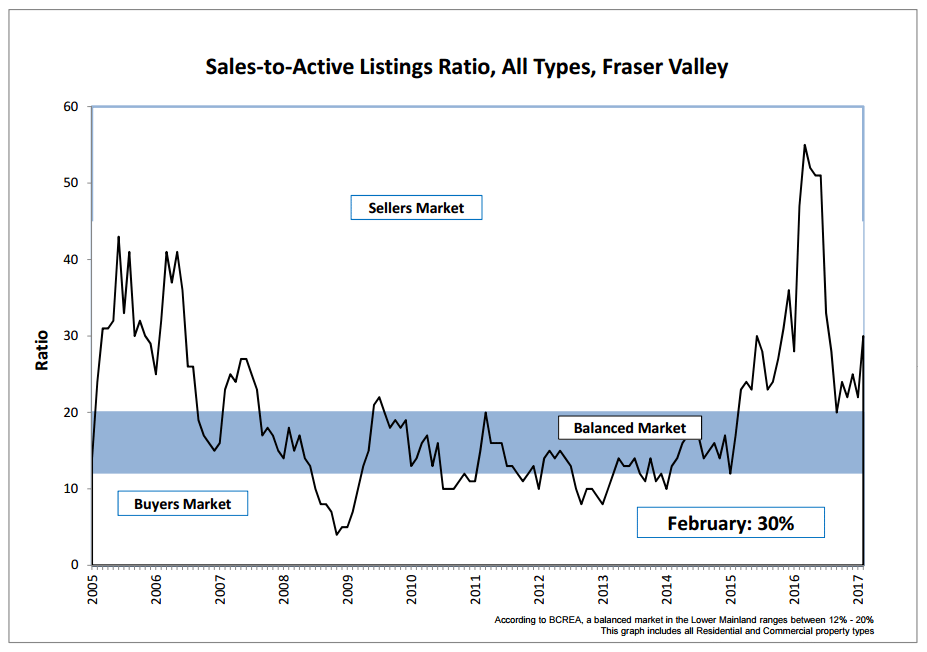
SURREY, BC – The Fraser Valley housing market returned to more typical levels in February, with sales and new listing intake on-par with the 10-year average for the month.
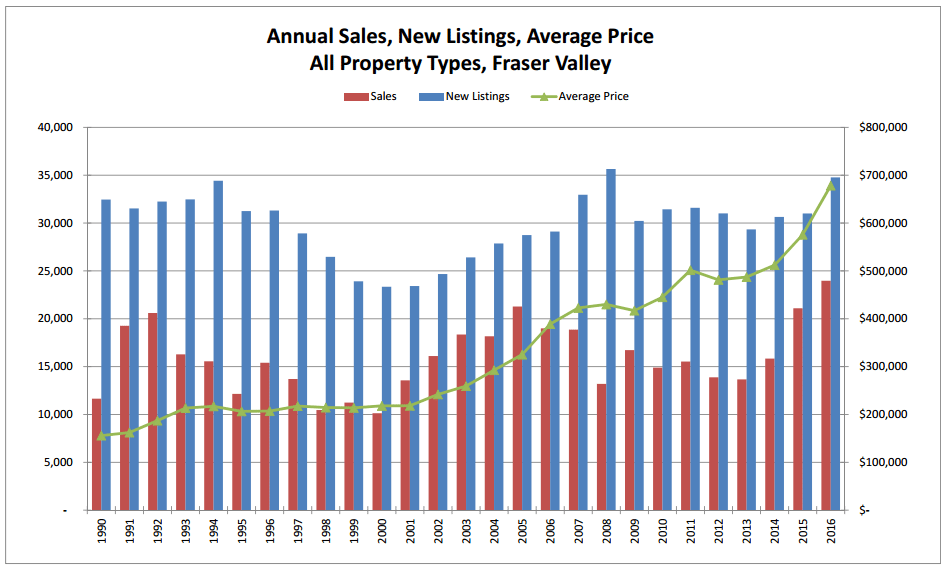
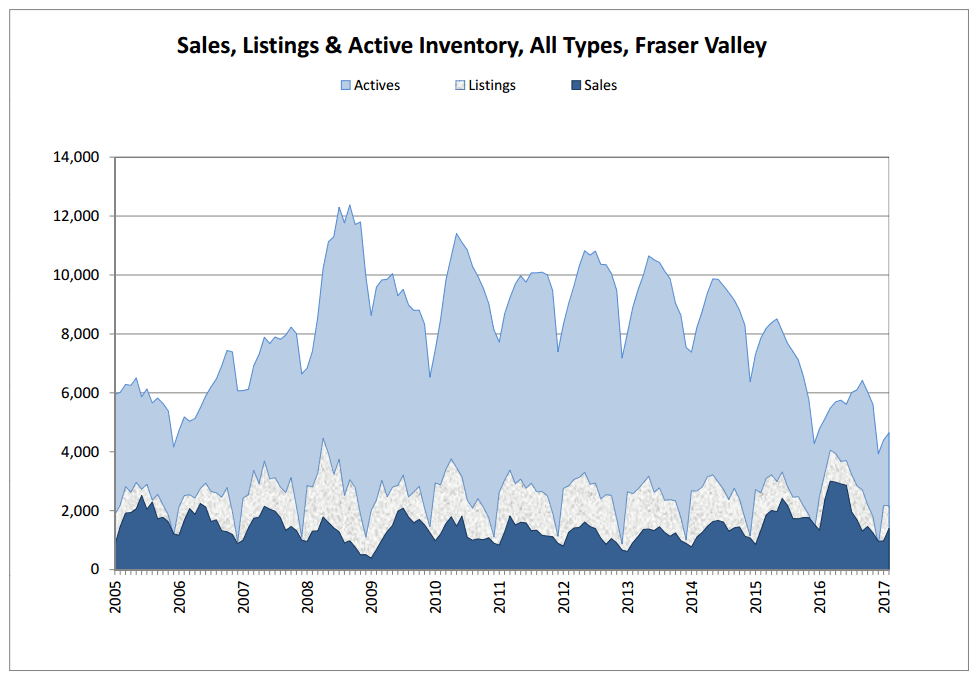
The Fraser Valley Real Estate Board processed 1,396 sales of all property types on its Multiple Listing Service® (MLS®) in February, a decrease of 41.5% compared to the record-breaking 2,387 sales in February of last year, and a 43% increase compared to the 976 sales in January 2017. The 10-year average for February sales is currently 1,288 transactions.
[bctt tweet=”46 Townhomes Sold in Cloverdale for February 2017 #SurreyBC” username=”jwsrealestate”]
Of the 1,396 sales processed last month, 369 were townhouses and 391 were apartments.
“This is the kind of February we like to see. Last year at this time, the incredible demand created a market that was difficult for consumers. Now, we have sales moving upward from the winter months at a typical, healthy pace and a growing inventory to support it,” said Gopal Sahota, Board President.
The Board received 2,171 new listings in February, a 0.3% decrease from January 2017, and a 33.9% decrease compared to February 2016’s 3,283 new listings.
For February the total active inventory in the Fraser Valley finished at 4,645 available listings, increasing by 5.5% month-over-month, and decreasing 9.4% when compared to February 2016.
“While the pace of the market has returned to more normal levels, pricing is still heavily impacted by the activity and demand seen throughout 2016. Understandably, this can create a challenging environment for consumers. If you’re struggling finding the right home or buyer, talk to a REALTOR® who can help guide you towards success in the market.”
For the Fraser Valley region, the average number of days to sell a single family detached home in February 2017 was 38 days, compared to 21 days in February 2016.
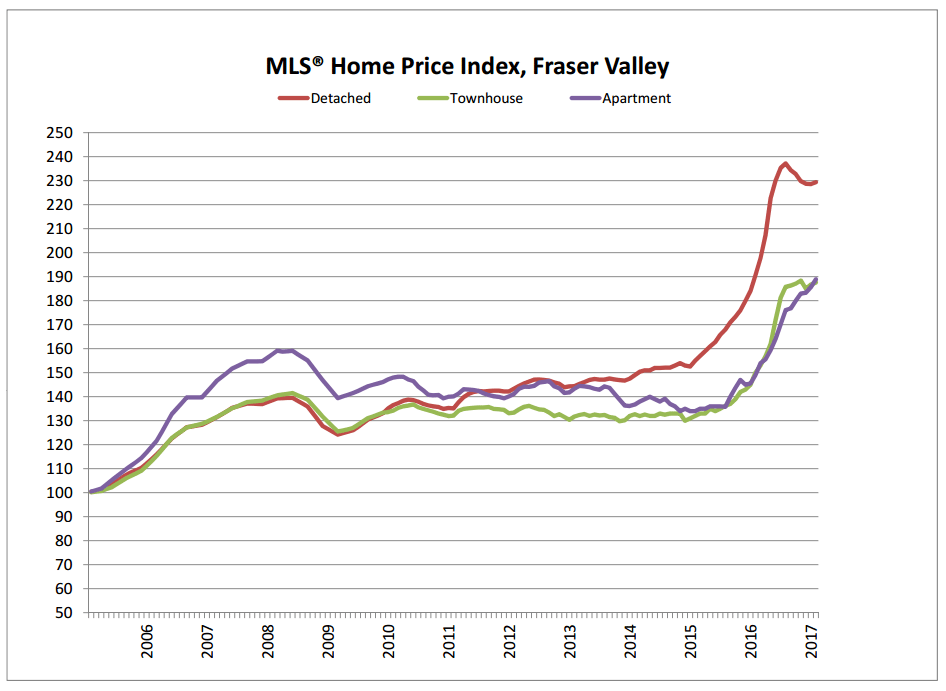
HPI® Benchmark Price Activity
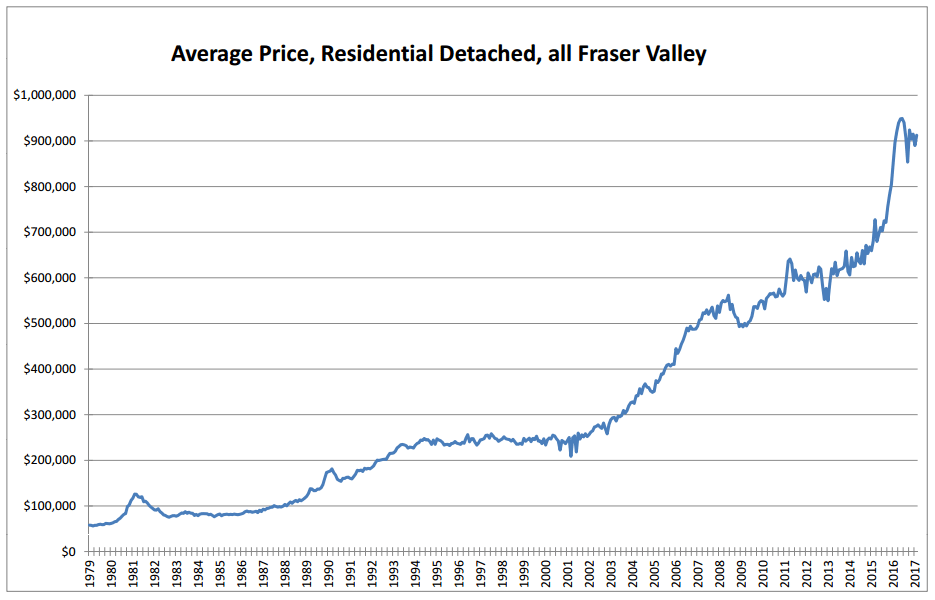
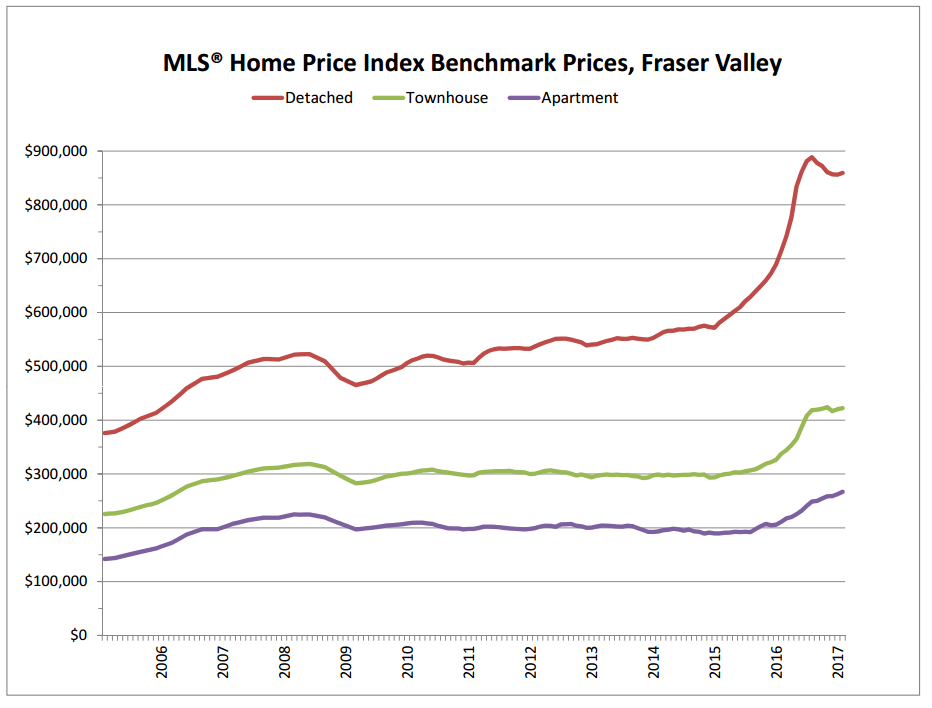
- Single Family Detached: At $859,300, the Benchmark price for a single family detached home in the Valley increased 0.4% compared to January 2017, and increased 20.4% compared to February 2016.
- Townhomes: At $422,400 the Benchmark price for a townhome in the Fraser Valley increased 0.5% compared to January 2017, and increased 25.2% compared to February 2016.
- Apartments: At $267,000, the Benchmark price for apartments/condos in the Fraser Valley increased 1.8% compared to January 2017, and increased 26.5% compared to February 2016.
.
Get The Full Monthly Statistics Package
[contact-form-7 id=”825″ title=”Email Form”] |